
 D2DCon
 Golden Door Summit
The Only 7 Sales Productivity Metrics That Matter for Door-to-Door Reps
Seven numbers predict your close rate in door to door sales. Most reps track the wrong four. Below: the seven that actually matter, the four to drop, and the daily-to-monthly cadence that turns tracking into a coaching loop you can run on yourself, even without a manager looking over your shoulder.
Quick Answer: Which Metrics Actually Matter?
For door-to-door reps, seven sales productivity metrics predict close: doors per hour, conversations per hour, pitch-to-close rate, average contract value, ride-along yield, activity-to-outcome ratio, and daily routine adherence. Skip the dashboard with thirty KPIs. The other twenty-three are vanity. The seven above are what top reps track every single day.
Why Most Sales Metrics Lists Don’t Work at the Door
Look up “sales productivity metrics” and you will get hit with the same few typical pointers from all directions — Activity in CRM. Email open rate. Sequence completion. Demos booked. MQL-to-SQL conversion.
None of that applies to your day.
You’re not loading a dialer. You’re not running an email sequence. You’re not waiting on a marketing team to drop leads in your pipeline. Your funnel is a sidewalk. Your top of funnel is a doorbell.
The metrics that predict whether you make money in D2D are different. Fewer. Simpler. Mostly tracked by hand.
Here’s the way to think about it. Every sales productivity metric is trying to answer one of three questions: Am I working enough? Am I working well? Am I working on the right things? Inside-sales metrics get really clever about question two and ignore questions one and three. D2D metrics have to handle all three at once. The seven below do.
The framework matters more than the tool. Below: the seven metrics, the formulas, the benchmarks, the fix for each one when it slips. If you want a tracker built around exactly these seven, there’s a free Excel companion at the bottom of this page. Read the framework first.
The Seven Metrics Top D2D Reps Track Every Day
These benchmarks aren’t guesses. They come from decades of proprietary door-to-door data owned by D2D Experts and years of training reps and consulting with home services companies. Every threshold below has been pressure-tested across hundreds of teams in pest, solar, roofing, fiber, and alarms.
Each metric below has the same shape. What it is. The formula. A benchmark for good, great, and elite. What it’s telling you when it slips. And the fix.
Run all seven together. They cross-check each other. A high doors-per-hour with a low pitch-to-close means you’re moving fast and saying nothing. A high pitch-to-close with low conversations-per-hour means you’re a great closer who can’t get past the screen door. The combination is the diagnosis.
1Doors knocked per hour
Your activity baseline. The simplest answer to “am I working?” Tracked by hand on a tally sheet or any daily-activity log.
Doors knocked ÷ hours in the field
When it slips: you’re losing time to phone-scrolling, long lunches, or driving between neighborhoods. Less about effort, more about routine.
The fix: set a tight area for the day. No driving more than two minutes between streets. Phone in the truck during work blocks. Pull tracking by the hour, not the day.
2Conversations per hour
Doors knocked is activity. Conversations is engagement. A door knock that ends in a no-answer or a porch bounce doesn’t count.
Real conversations ÷ hours in the field
When it slips: you’re knocking the wrong neighborhood, knocking the wrong time of day, or your opener is getting bounced before you get to talk.
The fix: if doors-per-hour is fine but conversations-per-hour is low, your opener is the problem. Re-record yourself. Drill it. If both are low, it’s the area or the time-of-day.
3Pitch-to-close rate
Once you’re in a real conversation, what percentage actually close? This is your skill score.
Deals closed ÷ full pitches delivered
Note: benchmarks shift by vertical. Solar pitches close higher than pest. Roofing storm-claim pitches close higher than retail roofing. Adjust to your line.
When it slips: the pitch is broken at a specific stage. Probably the close, probably the rebuttal stack on the third or fourth objection.
The fix: ride along with somebody who closes 40%+. Watch where their pitch differs from yours. Nine times out of ten it’s the pre-close, not the close itself.
4Average contract value
The size of the deals you’re closing. A 40% close rate on small deals is worse income than a 25% close rate on big ones.
Total revenue closed ÷ number of deals
(Benchmarks above are illustrative ranges, not your numbers. Pull yours from the last 90 days.)
When it slips: you’re selling on price. The customer is trading you down to the entry tier and you’re letting it happen.
The fix: lead with the high tier. Anchor the conversation on what most customers buy, not what fits the customer’s first-mention budget. The pitch position matters more than the discount.
5Ride-along yield (manager metric)
For team leads and sales managers. How much of the team’s production needs the manager in the field?
Deals closed without manager present ÷ total team deals
When it slips: the team is dependent on you closing for them. That’s a training and certification gap, not a recruiting problem.
The fix: certify the team on the pitch. Run formal role-plays. The whole point of D2DU’s vertical certifications is to remove the manager-as-bottleneck dependency.
6Activity-to-outcome ratio
The drift detector. Tells you whether your activity is producing outcomes, or whether you’re just busy.
Closed deals ÷ doors knocked (per week)
This isn’t a target you optimize for directly. It’s a check on the other five. If doors-per-hour is up but this ratio is dropping, you’re grinding without converting. If both are dropping, your routine fell apart.
When it slips: there’s a leak in the funnel and it can be at any stage. Use the other five to find which one.
The fix: diagnostic, not directly fixable. Cross-reference with metrics 1–3 to find the actual leak.
7Daily routine adherence rate
The leading indicator behind every other number. Are you running your routine, or skipping it on the days you don’t feel it?
Days you ran your full routine ÷ days you worked
When it slips: doesn’t announce itself. It shows up two weeks later in dropping doors-per-hour and falling close rates. By the time you see the lag, you’re already down a season.
The fix: track it on paper. A daily checkbox, anywhere you’ll actually look at it, is enough. Check or don’t. End-of-week count is the score.
That’s the full set. Doors. Conversations. Pitch-to-close. Contract value. Ride-along yield. Activity-to-outcome. Routine adherence. Seven numbers. Tracked daily. Reviewed weekly. The whole game.
The Metrics Most Managers Track That Don’t Predict Close
Plenty of teams build dashboards around numbers that look productive on paper and don’t move revenue. Cut these.
- Time logged in CRM. A rep with twenty CRM entries and three closed deals is worse than a rep with three entries and three closed deals. The CRM serves the deal. The deal doesn’t serve the CRM.
- Pipeline value. Pipeline without a close rate is fan fiction. A rep with $400k in “pipeline” closing 5% is doing worse than a rep with $80k closing 35%. Pipeline is a vanity unit when close rate isn’t in the same chart.
- Calls or follow-up touches. Carry-over from inside sales. In D2D, the touch that matters happened at the door. Phone follow-up is a closer signal, not a top-funnel signal.
- Hours worked. Two reps work the same eight hours. One does 240 doors and 35 conversations. The other does 90 doors and 8 conversations. Same hours. Different income. Hours are an input, not a metric.
None of these are useless. They’re context. They are not productivity metrics. Don’t put them on the same dashboard as the seven above.
How to Track These Without Losing Selling Time
The biggest mistake reps make tracking metrics is they spend half a Tuesday building a spreadsheet instead of knocking. Don’t do that.
The system is simpler than you’d think.
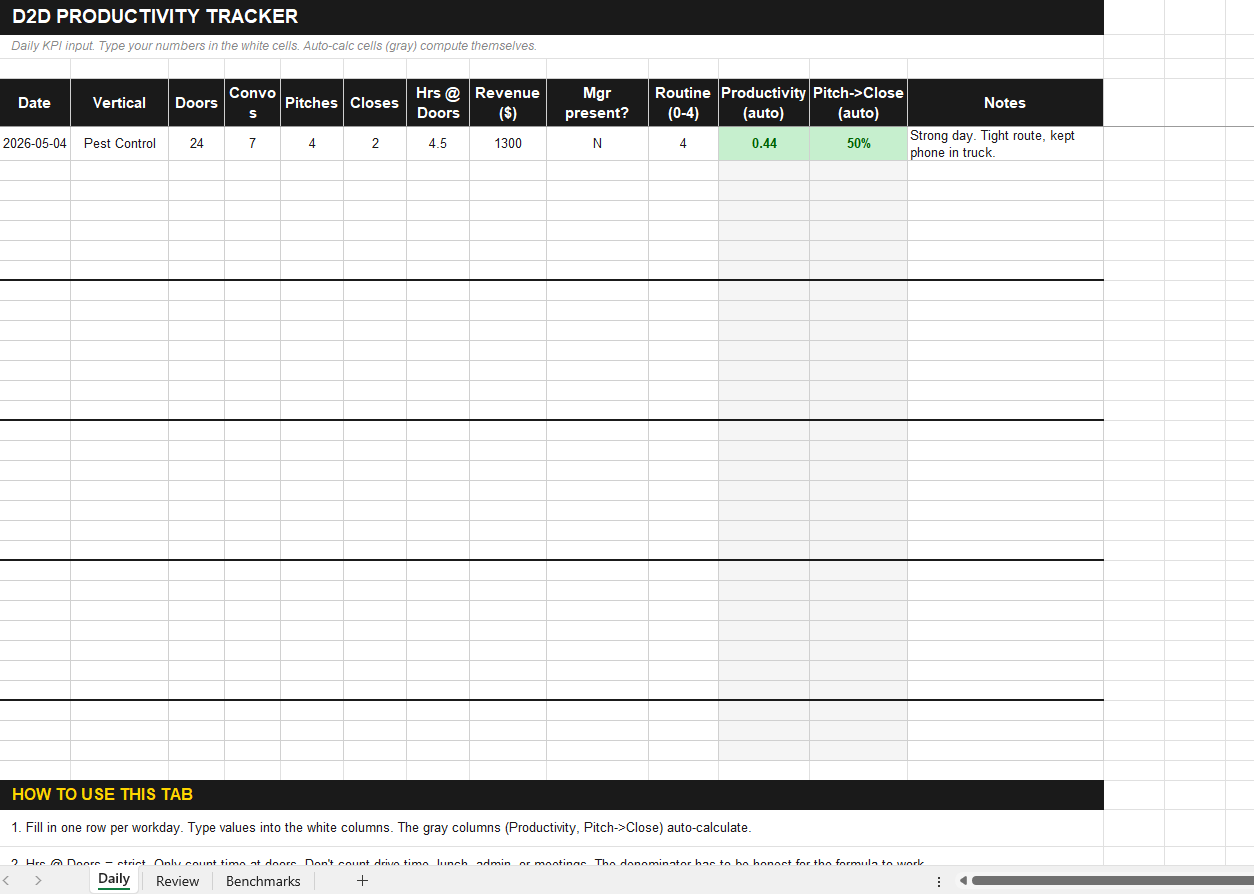
All seven metrics live in the Tracker. One row per workday. Type in your numbers at end of shift — Doors, Convos, Pitches, Closes, Hours at Doors, Revenue, Mgr present, Routine score. Productivity (closes ÷ hours) and Pitch-to-Close auto-calculate on every row. Below-benchmark numbers flag in red automatically.
The Planner protects the denominator. Time-block your selling hours so “Hours at Doors” is real selling time, not drive time or lunch. The Tracker can only be honest if the hours that go into it are honest.
The CRM stays the audit trail. Use D2D CRM for customer records and pipeline detail. Don’t double-track the same number in both places — the Tracker owns KPIs, the CRM owns customers.
The cadence that works
Daily, at the end of the shift: ten minutes. Fill in your day’s row in the Tracker. Doors, conversations, pitches, closes, ACV. That’s the seven minutes between the truck and dinner. Not optional.
Weekly, end of week: thirty minutes. Open the Review tab. Every ratio is already computed. Compare each one against its benchmark column. Pick the metric farthest from target. That’s your focus for next week.
Monthly, end of month: an hour. Look at the trend on each metric over four weeks. The trend is the signal. A single bad week is noise.
Run that cadence and you have the data to coach yourself. Skip it and you’re guessing.
Three Common Mistakes Managers Make With Sales Metrics
If you’re running a team, the metrics framework above is the floor. The mistakes below are how teams break it.
Mistake 1: tracking too many metrics. The dashboard with thirty KPIs gets ignored. The dashboard with seven gets read. Cut everything outside the seven into a separate “reference” sheet that managers look at quarterly, not weekly.
Mistake 2: benchmarking across verticals. A pest rep’s 35% close rate isn’t comparable to a solar rep’s 12%. Different deal sizes, different sales cycles, different objection sets. Benchmark within vertical. Mixing them produces useless rankings and demoralized reps.
Mistake 3: tracking metrics without changing the routine they reveal. A team that tracks ride-along yield and never changes the certification or coaching plan is just generating a number. The point of metrics is to drive the next decision. If the number doesn’t change a behavior, stop tracking it.
The Productivity Tracker That Calculates the Seven Metrics For You
The D2D Productivity Tracker is the Excel companion to the D2D Planner. The Planner runs your day. The Tracker measures whether the day produced. Designed around exactly the seven metrics on this page.
Three tabs: Daily input with auto-calculated Productivity and Pitch→Close on every row, Review that auto-rolls every metric and ratio for the month, and Benchmarks per vertical so the conditional formatting flags whichever number is below target.
You get both the Tracker (Excel) and the existing D2D Planner (PDF) in one email. The Planner protects the hours. The Tracker measures them.
Common Questions About Sales Productivity Metrics
Do I really need to track all seven? Can I just track close rate?
No, and no. Close rate alone is the trap. A rep with a 30% close rate but only three pitches a week is broke. A rep with a 15% close rate but twenty pitches a week is making money. The metrics work as a system because they cross-check each other. Drop any one and you lose diagnostic power on at least one other.
What if I’m a one-person operation? Do the manager metrics apply?
Skip metric 5 (ride-along yield). It’s a team metric. The other six all apply to a solo rep. If you’re building toward a team, start tracking metric 5 on yourself first — how much of your close rate depends on which conditions. That’s the foundation for training the team you hire next year.
My CRM doesn’t track most of these. What do I do?
Most CRMs are built for inside sales and don’t track door-knocked counts or in-field conversation rates. You have two options. One: track activity metrics in the Tracker and use the CRM only as a customer record. Two: use a D2D-native CRM. D2D CRM is built around exactly these seven metrics. Either works. Don’t force a generic CRM to do what it can’t.
How long before I should expect to see my numbers improve?
Activity metrics (doors, conversations) move in a week if you adjust the routine. Skill metrics (pitch-to-close, contract value) take three to six weeks because you’re changing how you talk, not just how you move. Don’t panic-pivot the pitch after one bad week. Pivot after three.
What’s the difference between sales productivity metrics and sales KPIs?
Mostly nothing. KPI just means “key performance indicator” — the small set of metrics you’re actually accountable to. The seven on this page are sales productivity metrics AND the right KPI set for a D2D rep. Other dashboards may call them something else. Same numbers, same job.
Are these benchmarks the same for new reps and veteran reps?
Doors-per-hour and conversations-per-hour benchmarks apply to anyone. Skill metrics like pitch-to-close don’t. A new rep at 10% close in their first 30 days is on track. A veteran at 10% close in week three of the season has a problem. Always read the metric in context of the rep’s tenure and the season’s stage.